Veteran of 52 vintages and the varying weather they have exhibited, Brian Croser, of Tapanappa in South Australia, wonders whether they’re in for a cooler period.
For the avoidance of doubt and of a fusillade of online scorn and abuse, what I am about to describe is the beginning of a cool vintage against a backdrop of inexorably increasing temperatures.
The Australian wine community is very fortunate to have access to the day-by-day heat-accumulation data for the seven-month vine-growing season (October to April) for each vintage and region for the past 100 years. Our very effective national climate and scientific institutions the Australian Bureau of Meteorology (BOM) and the Commonwealth and Industrial Research Organisation (CSIRO) combine their resources to map climate, past and present, over the Australian continent. This resource crystallises for the nation’s vineyards in two online tools called CliMate and ARMonline, both operated by the University of Southern Queensland.
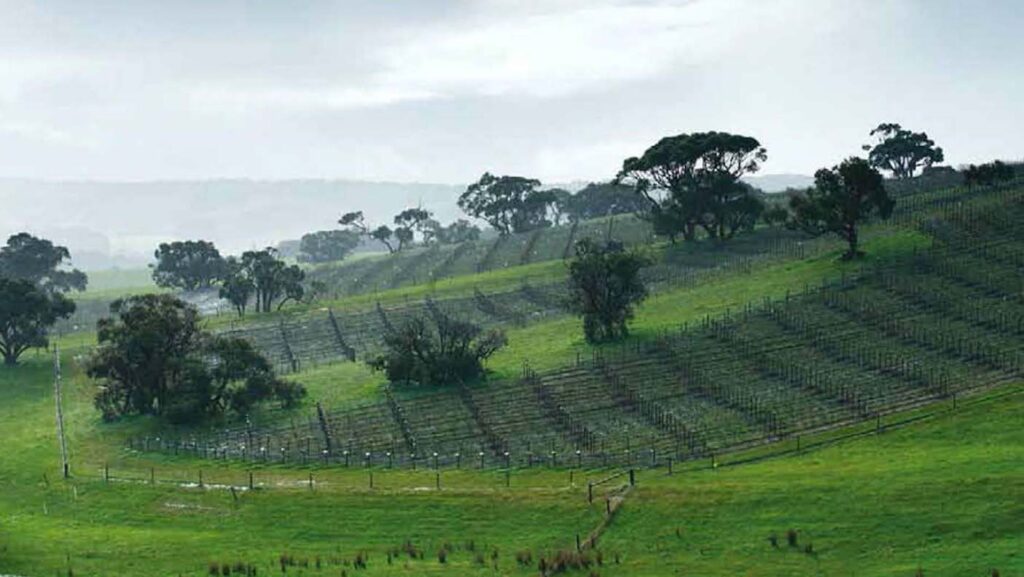
In Tapanappa’s three vineyards, The Tiers in the Piccadilly Valley, Foggy Hill at Parawa on the Fleurieu Peninsula (pictured above) and Whalebone at Wrattonbully, the first three months of the 2022 growing season rank among the 20 coolest starts of the last 100 years. Furthermore, there are no years with as cool or cooler first three months that exceeded the average heat summation for the region at the end of the seven-month growing season. So it seems very likely that all three vineyards are going to record a cooler-than-average 2022 growing season and possibly markedly cooler.
This is after the 2020 and 2021 vintages that were slightly cooler than the 30-year average. These two vintages and the beginning of 2022 have offered welcome relief from the fiery 15-year era from 2005 to 2019 during which average growing-season temperatures were 0.65 °C greater than the average from 1961 to 1990, the baseline period that the BOM use to measure the extent of recent temperature increases.
In viticultural terms, 0.65 °C across a growing season is a lot. It is the difference between a vineyard growing Pinot Noir and Chardonnay for sparkling wine or table wine, the difference between growing great Chardonnay and mediocre Chardonnay or even the difference between successfully growing Pinot Noir and Cabernet Sauvignon.
Dare I hope that 2020, 2021 and 2022 are the beginning of a sequence of cooler vintages in my vineyards? Are there alternating eras of cool and hot vintages rather than the random occurrence of each?
The latter question first occurred to me in the late 1960s when I was a student of Dr Bryan Coombe at the University of Adelaide’s Waite Research Institute, learning about the primacy of climate as an influence on wine quality. Since then, tantalising glimpses of the existence of climate temperature cycles have materialised over the 52 vintages I have recorded the weather in my various vineyards.
It is difficult to reconcile and standardise the temperature recordings in the vineyards I have owned in the Clare Valley, Piccadilly Valley, Coonawarra, Fleurieu Peninsula and Wrattonbully, some from my own weather stations and some from nearby BOM official weather-recording stations. To further compound the difficulty of comparison, the question occurs, what is the correct average heat accumulation to compare with a current vintage unfolding when that average is moving inexorably upwards?
Finally, the online tool already described, ARMonline, has created the opportunity to interpret the temperature data for Foggy Hill Vineyard at Parawa on the Fleurieu Peninsula in blocks of time of my choosing.
I began the analysis by averaging decade blocks of the seven-month heat accumulation, beginning with 1920–1929 and ending with 2010–2019, 10 averages in all. A clear pattern emerged, but I then looked at decades beginning with a 5, starting with 1925–1934 and finishing with the not-quite-a-decade 2015–2021. (There is no rule that a decade should begin with a zero, except that arbitrary choice of the beginning of time to coincide with a certain birth in a manger in Bethlehem.) The pattern became even clearer.
Up until 1995–2004 most of the decades were cooler than the 100-year average. Two exceptionally cold decades were 1945–1954 and 1995–2004 being respectively 7.2% and 7.5% below the average. The two exceptionally hot decades were 2005–2014 and 2015–2021, respectively 9.3% and 13% above the average.
‘Ha!’, you will say. These last two are the most recent and hottest decades because of climate change. Well, there is no doubting that climate change is an underlying force leading to an increasing average temperature since the beginning of the industrial age. There is also no doubt the rate of change is increasing, but is climate change responsible for the massive 22.2% difference between the cool decade of 1995–2004 and the succeeding hot 15 years 2005–2019? 1995–2004 is 7.5% below the 100-year average and 2005–2019 is 13% above the 100-year average.
I think there may be other climate forces at play reflected in the 100-year pattern that I plot below. The width of the bars reflects the length of the time and the blue and red add context. My thesis/hope based on the previous patterns is that we have been through a dramatically hotter era (2005–2019) and that the three vintages 2020, 2021 and now 2022 represent a relief from the heat. 2022 is tracking markedly below the average. Just maybe we are entering another swing of the cycle as in 1995–2004. That’s my hope.
Jancis asked, ‘How confident are you about the cycles?’. I am confident cycles do exist, as demonstrated by this graph, but I could not say with certainty we are really entering another cool swing. I will answer that in five years’ time.
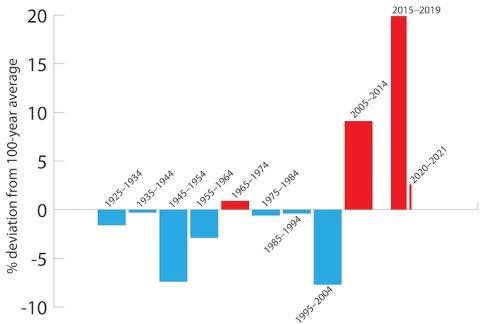
Note: the 2020–2021 two-year period is derived from CliMate, compared with the 100-year average. All other data are from ARMonline, compared with the 100-year average.
Does the cooler 2020–2021 two-year period and the likely cooler-than-average 2022 represent the beginning of another cool climate cycle imposed on top of climate change?
Maybe, and I certainly hope so as I would like to spend my last vintages tending to cooler-grown fruit that invariably produces the best wines.
Vignerons are at the mercy of the weather, as recent events in many wine regions around the globe attest. We have no control over the atmospheric events above and around our vines. We prostrate ourselves at the feet of the weather gods when we choose where to plant our vineyard. A careful choice of site can diminish the chances of hail, frost, wind and too much or too little rain and humidity. We can choose a site with the correct growing-season temperature range for the varieties we plant. But in the end the weather gods decide what each vintage will look like for every vineyard, and the vigneron has no choice but to go with the flow.
Looking back on 52 vintages, I can say one of the few certainties is that the next vintage will be different from the previous 52.